
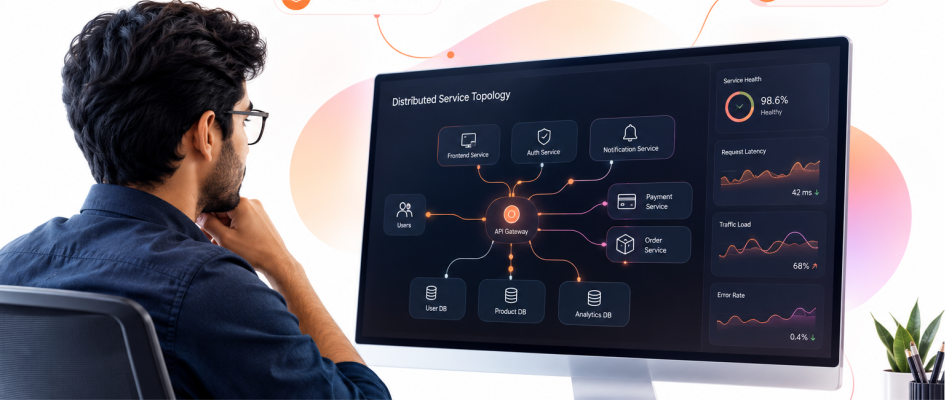
Distributed Service Topology
Automated service graph discovery mapping microservice dependencies across EKS, GKE, ECS, and bare-metal environments with zero manual instrumentation.

Modern cloud environments generate signals everywhere. QuietMetric brings those signals together, helps your team understand unusual system behaviour, and highlights potential operational risks before they become bigger problems.
See what’s happening. Understand what’s changing. Act earlier.

Switch between monitored production services, inspect live telemetry metrics, or simulate an operational anomaly to watch QuietMetric detect risk in seconds.
Built on OpenTelemetry standards, a structured SQL operational datastore, and predictive ML scoring that scales to millions of spans per second.
Automated service graph discovery mapping microservice dependencies across EKS, GKE, ECS, and bare-metal environments with zero manual instrumentation.
Calculates dynamic 95% confidence bands over circadian traffic cycles. Surfaces early metric drift and resource bottlenecks hours prior to service degradation.

Transform overwhelming operational noise into actionable incidents. Correlate alerts to root-cause commits, assign SRE responders, and track historical post-mortems.
QuietMetric shifts cloud operations from reactive incident firefighting to automated resilience—protecting revenue, eliminating alert fatigue, and accelerating deployment frequency.

Unmitigated cloud outages cost an average of $336,000 per hour. Predictive anomaly correlation identifies resource saturation and connection pool exhaustion before user transactions drop.

Static thresholds flood SRE on-call rotations with false alarms. QuietMetric’s AI topology clustering compresses cascading warnings into a single deduplicated incident graph.

Continuous Gaussian baseline learning flags subtle metric drift, slow memory leaks, and cascading latency degradation hours before standard threshold alarms breach.

Pinpoints culprit microservices, failing Kubernetes pods, and database bottlenecks instantly with code-level stack traces and Git commit correlation—eliminating chaotic war rooms.

Reclaim hundreds of engineering hours lost to non-critical alert triage and midnight pages. Engineers redirect focus toward infrastructure improvements, resilience, and roadmap features.

Protect critical enterprise service-level agreements and eliminate customer SLA breach penalties with automated multi-environment telemetry guards across AWS, GCP, and Azure.

Modern cloud environments drown DevOps teams in raw telemetry. Millions of metric datapoints, overlapping alerts, and fragmented dashboards trigger on-call alert fatigue, leaving critical systemic failures hidden in plain sight.
QuietMetric was architected around a simple truth: the best telemetry is quiet. By pairing structured SQL storage with predictive time-series machine learning, we identify subtle drift patterns and saturation risks hours before they impact real users.
Integrate effortlessly using standard OpenTelemetry collectors, lightweight CLI commands, and performant SQL queries.
# quietmetric-otel-collector.yaml
receivers:
  otlp:
    protocols:
      grpc: { endpoint: "0.0.0.0:4317" }
      http: { endpoint: "0.0.0.0:4318" }
  prometheus:
    config:
      scrape_configs:
        - job_name: 'kubernetes-pods'
          scrape_interval: 5s

processors:
  batch: { timeout: 200ms, send_batch_size: 1024 }
  quietmetric_anomaly:
    confidence_threshold: 0.95
    baseline_window: "14d"

exporters:
  quietmetric:
    endpoint: "https://ingest.quietmetric.net/v1/telemetry"
    api_key: "${QUIETMETRIC_INGESTION_KEY}"
Transparent subscriptions based on registered services—not punishing per-gigabyte metric ingest penalties.
Ideal for scaling engineering teams monitoring up to 15 core cloud services with essential anomaly alerts.
Full predictive operations suite for multi-environment production Kubernetes and cloud environments.
Air-gapped on-premise or private VPC deployments with custom retention and dedicated SRE advisory.
Everything you need to know about how QuietMetric helps teams understand system health, monitor performance, and predict anomalies.
QuietMetric is an observability and predictive operations platform designed to help cloud and DevOps teams understand the health and behaviour of their systems.
It brings service monitoring, metrics, alerts, incidents, anomaly analysis, and historical performance into one place.
Modern systems generate a lot of operational information. The challenge is often not collecting it, but understanding which changes actually matter.
QuietMetric helps bring that information together so your team can identify unusual behaviour, investigate incidents, and understand performance over time.
QuietMetric looks at operational information and historical patterns to help identify unusual or changing system behaviour.
The purpose is to give your team another useful signal to investigate not to automatically decide what your engineers should do.
The platform is built around a Laravel/PHP backend and SQL data layer, with structured processing for operational metrics, alerts, incidents, anomaly analysis, and predictive insights.
The technology showcase also includes NVIDIA NeMo, RAPIDS, Triton, and NIM.
Every infrastructure environment has its own challenges. Whether you're monitoring a growing set of services or managing a large enterprise fleet, understanding your setup helps us have a more useful conversation about observability and operational intelligence.
Bring your current challenges. We'll bring the questions, context, and operational perspective.